How to attach the Visual Studio debugger to the right IIS worker process
By Tan Lee Published on Nov 19, 2024 765
When debugging with Visual Studio, you may need to attach the debugger to one or more IIS worker processes (`w3wp.exe`). A common approach is using CKSDev to attach to all processes or simply using Ctrl+P to select processes from the list. However, this can sometimes slow down your development environment or catch exceptions from unrelated code.
Ideally, you'd want to attach to a single process to focus on the code you're debugging. The challenge is identifying the correct `w3wp.exe` process, as you might have multiple instances running (3-6), and it's difficult to determine which one is relevant based solely on the process ID.
To identify the correct IIS worker process (w3wp.exe) for debugging, you can use the appcmd utility, which helps pinpoint the exact process.
Open a Command Prompt with administrator privileges.
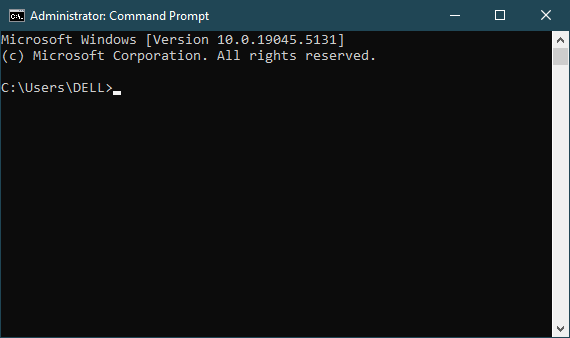
Next, Navigate to the directory where appcmd is located, typically
cd %systemroot%\system32\inetsrv
Run the following command to list all running worker processes
appcmd list wp
This will return a list of worker processes, showing the process ID and the application pool they belong to.
Before attaching the debugger, make sure that debugging is enabled in IIS
Open Internet Information Services (IIS) Manager, then select your site under Sites.
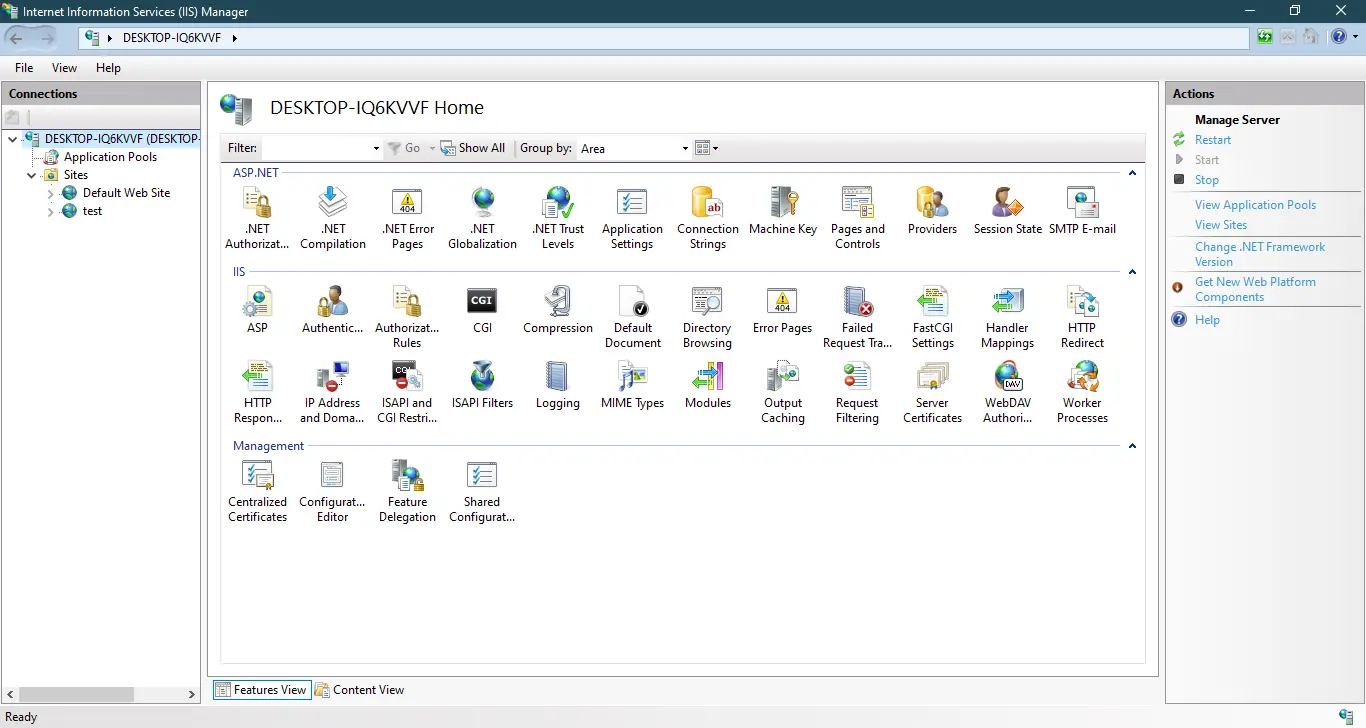
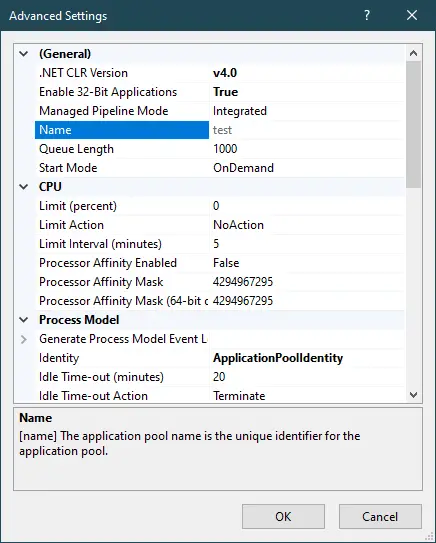
In the Application Pool settings for your application, check the "Enable 32-bit Applications" setting, especially if your app is targeting 32-bit.
Launch Visual Studio and open the solution or project you want to debug.
ASP.NET: Ensure that your web.config has the debug attribute set to true in the <compilation> element.
<compilation debug="true" targetFramework="4.8.1" />
ASP.NET Core: Make sure to use the appropriate environment variables or launch settings for debugging (typically ASPNETCORE_ENVIRONMENT=Development).
You need to find the correct w3wp.exe process that corresponds to your web application as shown above.
Now that you have identified the correct w3wp.exe process, you can attach the debugger:
In Visual Studio, go to Debug > Attach to Process (or press Ctrl+Alt+P).
In the Attach to Process dialog:
- In the Show processes from all users section, check the box.
- Look for
w3wp.exein the list of processes. - Select the correct
w3wp.exeprocess that corresponds to your application pool. - Ensure that Type is set to
Managed Code(for .NET applications).
Finally, Click Attach.
Once attached, set breakpoints in your code where needed, and trigger requests to your web application.


