How to use Live Charts in C#
By Tan Lee Published on Jun 03, 2017 17.4K
To use LiveCharts in a C# Windows Forms application, follow these steps.
LiveCharts is a simple, flexible, interactive, and powerful data visualization library for .NET. It allows developers to easily create engaging and dynamic charts with minimal effort.
How to use LiveCharts in C#?
Open Visual Studio, then click New Project, then select Visual C# on the left, then Windows and then select Windows Forms Application. Name your project "LiveChartDemo" and then click OK
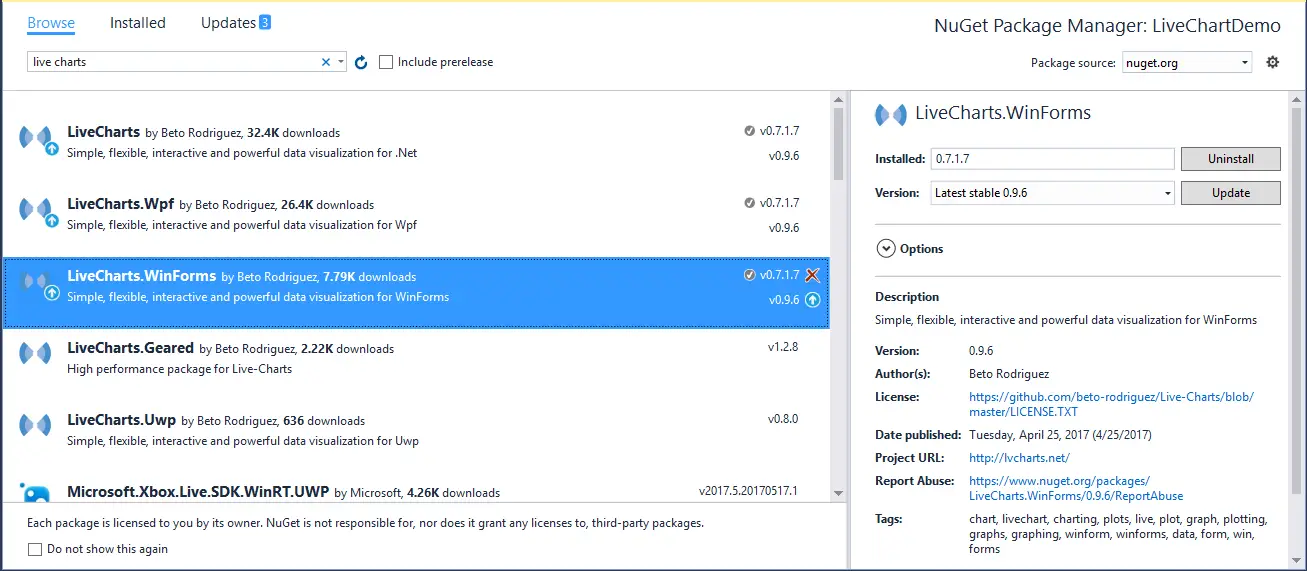
Right click on your project select Manage NuGet Packages -> Search live charts -> Install
Once the package is installed, add the necessary namespaces in your form's code file.
using LiveCharts.WinForms;
Open your form's Designer, then drag and drop the CartesianChart from the Toolbox onto your form.
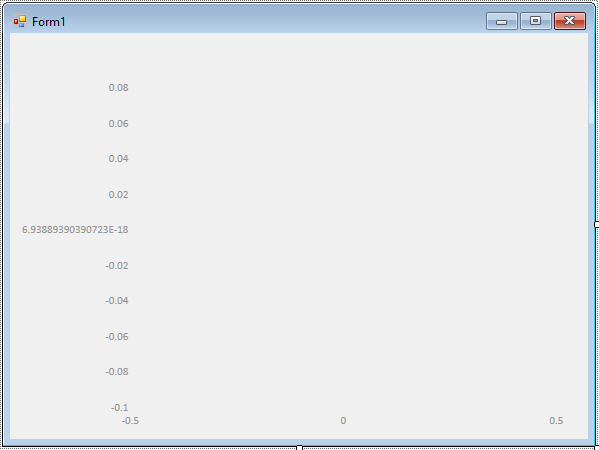
To display a live chart, you need to provide data.
You can create a stored procedure to get total orders from the orders table in the Northwind database, then add your stored procedure to Entity Framework Model First, then modify your code to handle the Form_Load event like this:
private void Form1_Load(object sender, EventArgs e)
{
    using (NorthwindEntities db = new NorthwindEntities())
    {
        // Retrieve data from stored procedure
        var data = db.GetTotalOrders();
        // Create columns chart
        ColumnSeries col = new ColumnSeries() { DataLabels = true, Values = new ChartValues<int>(), LabelPoint = point => point.Y.ToString() };
        Axis ax = new Axis() { Separator = new Separator() { Step = 1, IsEnabled = false } };
        ax.Labels = new List<string>();
        // Add data to your chart
        foreach (var x in data)
        {
            col.Values.Add(x.Total.Value);
            ax.Labels.Add(x.Year.ToString());
        }
        cartesianChart1.Series.Add(col);
        cartesianChart1.AxisX.Add(ax);
        cartesianChart1.AxisY.Add(new Axis
        {
            LabelFormatter = value => value.ToString(),
            Separator = new Separator()
        });
    }
}
LiveCharts makes it easy to create dynamic charts in C# Windows Forms applications. You can bind static data or continuously update the chart with new data.
VIDEO TUTORIAL
Categories
Popular Posts


Material Lite Admin Template
Nov 14, 2024

Portal HTML Bootstrap
Nov 13, 2024


10 Common Mistakes ASP.NET Developers Should Avoid
Dec 16, 2024