How to Link Chart /Graph with Database in C#
By Tan Lee Published on Jun 06, 2017 16.96K
This article explains how to integrate database operations (loading and saving) with a chart visualization in a Windows Forms application using C#.
How to Link Chart /Graph with Database in C#?
Open Visual Studio, then click New Project, then select Visual C# on the left, then Windows and then select Windows Forms Application. Name your project "ChartDemo" and then click OK
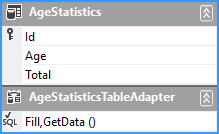
Create a local database, then add a AgeStatistic table to your database -> create a dataset then drag the AgeStatistic table to your dataset as shown below.
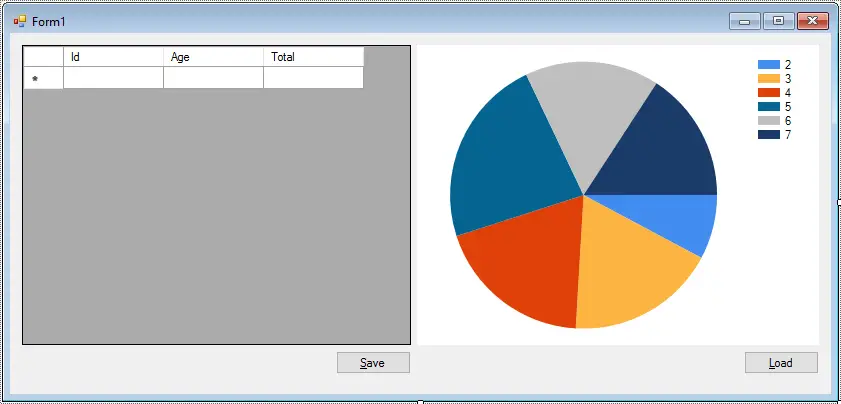
Design your form as shown below.
Initialize the Form and Load Data
private void Form1_Load(object sender, EventArgs e)
{
    // TODO: This line of code loads data into the 'database.AgeStatistics' table. You can move, or remove it, as needed.
    this.ageStatisticsTableAdapter.Fill(this.database.AgeStatistics);
}
Loads data from the AgeStatistics table into the bound DataSet (database) on form initialization.
Save Changes to the Database
private void btnSave_Click(object sender, EventArgs e)
{
    try
    {
        // Update data to sql database
        ageStatisticsBindingSource.EndEdit(); // Ensures that any pending edits are committed to the data source.
        ageStatisticsTableAdapter.Update(database.AgeStatistics); // Updates changes in the bound DataSet (database) back to the database.
        MessageBox.Show("Your data has been successfully saved.", "Message", MessageBoxButtons.OK, MessageBoxIcon.Information);
    }
    catch (Exception ex)
    {
        MessageBox.Show(ex.Message, "Message", MessageBoxButtons.OK, MessageBoxIcon.Error);
    }
}
Load Data into the Chart
private void btnLoad_Click(object sender, EventArgs e)
{
    // Set the chart's data source and bind data
    chart1.Series["Age"].XValueMember = "Age";
    chart1.Series["Age"].YValueMembers = "Total";
    chart1.DataSource = database.AgeStatistics;
    chart1.DataBind();
}
These map the X and Y axes to the Age and Total columns in the data source.
You need to place a Chart control on your form and name it chart1. Ensure that the Series name is set to "Age" in the properties window.
VIDEO TUTORIAL
- How to Open and Show a PDF file in C#
- How to Get all Forms and Open Form with Form Name in C#
- How to zoom an image in C#
- How to Print a Picture Box in C#
- How to update UI from another thread in C#
- How to Search DataGridView by using TextBox in C#
- How to read and write to text file in C#
- How to save files using SaveFileDialog in C#

