How to use Live Chart Graph Controls in C#
By Tan Lee Published on Jun 15, 2024 28.55K
To use Live Chart, Graph Controls in a C# Windows Forms Application, you can follow these steps.
Open your Visual Studio, then create a new Windows Forms Application project, then install the LiveCharts.WinForms from the Mange Nuget Packages to your project.
Next, Rebuild your project you will see the live chart control automatically add into your visual studio toolbox.
C# LiveCharts
Live Charts control is a c# chart library open source, it's simple, flexible, interactive & powerful data visualization for .Net LiveCharts is just data visualization but built and for everyone.
C# CartesianChart
The Cartesian Chart class allows you to plot any series that uses a Cartesian coordinate system, each point is a pair of values (X, Y), in simple terms Y will be the value you passed and X index of the value in the array.
The Cartesian charts support multiple series and you can combine any series in a cartesian chart.
Opening your form designer, then drag and drop then CartesianChart, DataGridView and Button controls from the Visual studio toolbox to your winform.
Creating the Revenue class, then add a bindingsouce to the DataGridView
public class Revenue
{
    public int Year { get; set; }
    public int Month { get; set; }
    public double Value { get; set; }
}
Adding the Form_Load event handler allows you to initalize the CartesianChart
// livechart winforms chart example
private void Form1_Load(object sender, EventArgs e)
{
    revenueBindingSource.DataSource = new List<Revenue>();
    cartesianChart1.AxisX.Add(new LiveCharts.Wpf.Axis
    {
        Title = "Month",
        Labels = new[] { "Jan", "Feb", "Mar", "Apr", "May", "Jun", "Jul", "Aug", "Sep", "Oct", "Nov", "Dec" }
    });
    // Set labels and other properties as needed
    cartesianChart1.AxisY.Add(new LiveCharts.Wpf.Axis
    {
        Title = "Revenue",
        LabelFormatter = value => value.ToString("C")
    });
    cartesianChart1.LegendLocation = LiveCharts.LegendLocation.Right;
}
Adding the click event handler to the Load button allows you to set data to the CartesianChart
private void btnLoad_Click(object sender, EventArgs e)
{
//Init data
cartesianChart1.Series.Clear();
SeriesCollection series = new SeriesCollection();
var years = (from o in revenueBindingSource.DataSource as List<Revenue>
select new { Year = o.Year }).Distinct();
foreach (var year in years)
{
List<double> values = new List<double>();
for (int month = 1; month <= 12; month++)
{
double value = 0;
var data = from o in revenueBindingSource.DataSource as List<Revenue>
where o.Year.Equals(year.Year) && o.Month.Equals(month)
orderby o.Month ascending
select new { o.Value, o.Month };
if (data.SingleOrDefault() != null)
value = data.SingleOrDefault().Value;
values.Add(value);
}
series.Add(new LineSeries() { Title = year.Year.ToString(), Values = new ChartValues<double>(values) });
}
cartesianChart1.Series = series;
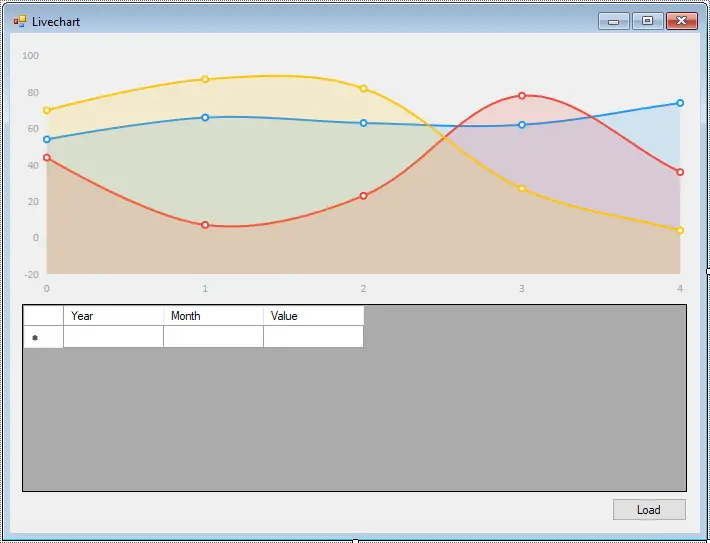
}We will display revenue by year with the CartesianChart.
In this example, I've created a simple Windows Forms application with a CartesianChart control named cartesianChart1. I've added two LineSeries to the chart and assigned some sample data to each series. Finally, I've customized the X and Y axes with titles and labels.
VIDEO TUTORIAL
Categories
Popular Posts

Implement security headers for an ASP.NET Core
Jun 24, 2025

Structured Data using FoxLearn.JsonLd
Jun 20, 2025


RuangAdmin Template
Nov 13, 2024

Material Lite Admin Template
Nov 14, 2024