Windows Forms: How to create line chart in C#
By FoxLearn 10/21/2020 7:51:21 PM 23.9K
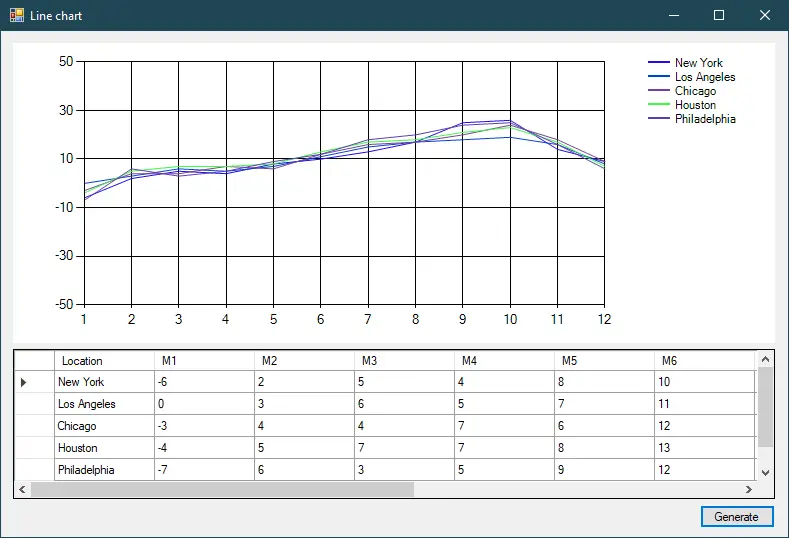
This post shows you How to create multiple line charts using Chart control in C# Windows Forms Application.
Creating a new Windows Forms Application project, then drag Button, DataGridView and Chart controls from your Visual Studio toolbox into your form designer. You can modify your layout as shown below.
This is a simple desktop application allows you to enter data to DataGridView, then draw multiple line charts with random color based on your data from DataGridView.
c# plot graph x y
After you finish designing the layout, you need to create a temperature class allows you to map data you add to DataGridView. Where the X axis represents the month, the Y axis represents the temperature.
public class Temperature
{
    public string Location { get; set; }
    public decimal M1 { get; set; }
    public decimal M2 { get; set; }
    public decimal M3 { get; set; }
    public decimal M4 { get; set; }
    public decimal M5 { get; set; }
    public decimal M6 { get; set; }
    public decimal M7 { get; set; }
    public decimal M8 { get; set; }
    public decimal M9 { get; set; }
    public decimal M10 { get; set; }
    public decimal M11 { get; set; }
    public decimal M12 { get; set; }
    public object this[string propertyName]
    {
        get { return this.GetType().GetProperty(propertyName).GetValue(this, null); }
        set { this.GetType().GetProperty(propertyName).SetValue(this, value, null); }
    }
}
And don't forget to add an indexer allows you to get property value from the property name in c#.
Adding a Form_Load event handler to your form allows you to initialize the temperature datasource, you can do that by double clicking on your form.
private void Form1_Load(object sender, EventArgs e)
{
    temperatureBindingSource.DataSource = new List<Temperature>();
}
multiple line chart in c# windows application
Finally, Add a click event handler to the Generate button allows you to draw line chart in c#.
private void btnGenerate_Click(object sender, EventArgs e)
{
    var objChart = chart.ChartAreas[0];
    objChart.AxisX.IntervalType = System.Windows.Forms.DataVisualization.Charting.DateTimeIntervalType.Number;
    //month 1-12
    objChart.AxisX.Minimum = 1;
    objChart.AxisX.Maximum = 12;
    //temperature
    objChart.AxisY.IntervalType = System.Windows.Forms.DataVisualization.Charting.DateTimeIntervalType.Number;
    objChart.AxisY.Minimum = -50;
    objChart.AxisY.Maximum = 50;
    //clear
    chart.Series.Clear();
    //random color
    Random random = new Random();
    //loop rows to draw multi line chart c#
    foreach (Temperature t in temperatureBindingSource.DataSource as List<Temperature>)
    {
        chart.Series.Add(t.Location);
        chart.Series[t.Location].Color = Color.FromArgb(random.Next(256), random.Next(256), random.Next(256));
        chart.Series[t.Location].Legend = "Legend1";
        chart.Series[t.Location].ChartArea = "ChartArea1";
        chart.Series[t.Location].ChartType = System.Windows.Forms.DataVisualization.Charting.SeriesChartType.Line;
        //adding data
        for (int i = 1; i <= 12; i++)
            chart.Series[t.Location].Points.AddXY(i, Convert.ToInt32(t[$"M{i}"]));
    }
}
Through this c# example, i hope so you can understand how to use chart control to draw multiple line charts in c# windows forms application.
VIDEO TUTORIAL
Categories
Popular Posts


Visual Studio: Auto increment version
04/01/2024

What is ARM architecture?
04/01/2024

What Are RESTful Web Services?
02/19/2024
