How to Create a Stock Chart or Candlestick Chart in C#
By Tan Lee Published on May 25, 2024 18.85K
Creating a Stock Chart or Candlestick Chart using the Chart control in a C# Windows Forms Application involves several steps.
To create Stock Chart and Candlestick Chart in a C# Windows Forms Application using the Chart control, you can follow these steps:
Open your Visual Studio, then click New Project, then select Visual C# on the left, then Windows and then select Windows Forms Application. Name your project "StockChart" and then click OK
How to create a Stock Chart or Candlestick Chart in C#
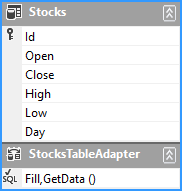
Create a local database, then add a stock table to your database -> create a dataset then drag the stock table to your dataset as shown below
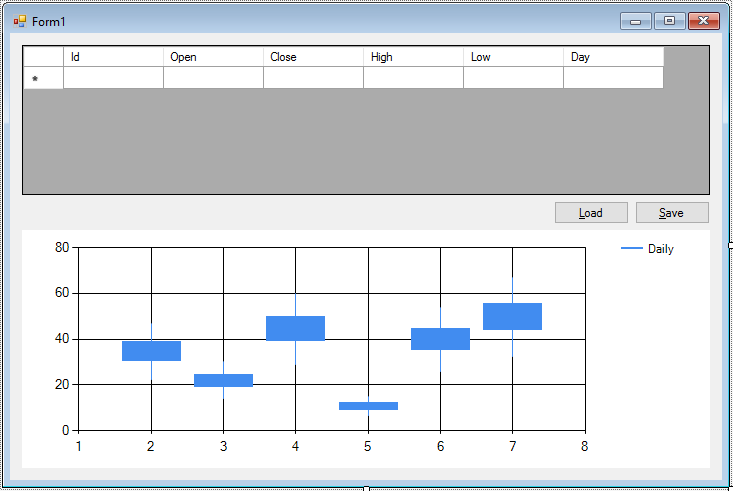
Drag and drop DataGridView, Button, Chart controls from the Visual Studio toolbox onto your form designer, then design your form as below
For stock charts and candlestick charts, you typically need historical price data, you can generate sample data by editing from the DataGridView or loading from the xml file.
Here's a basic example of how you might implement this.
Adding a Form_Load event handler allows you to fill data from local database to table adaper.
private void Form1_Load(object sender, EventArgs e)
{
    // TODO: This line of code loads data into the 'database.Stocks' table. You can move, or remove it, as needed.
    this.stocksTableAdapter.Fill(this.database.Stocks);
}
Adding a click event handler to the Save button that allows you to save data from DataGridView to local database.
private void btnSave_Click(object sender, EventArgs e)
{
    try
    {
        stocksBindingSource.EndEdit();
        stocksTableAdapter.Update(database.Stocks);
        dataGridView.Refresh();
        MessageBox.Show("Your data has been successfully saved.", "Message", MessageBoxButtons.OK, MessageBoxIcon.Information);
    }
    catch (Exception ex)
    {
        MessageBox.Show(ex.Message, "Message", MessageBoxButtons.OK, MessageBoxIcon.Error);
    }
}
Finally, Add a click event handler to the Load button allows you to load data from DataGridView to chart control.
private void btnLoad_Click(object sender, EventArgs e)
{
    //Clear Grid
    chart.ChartAreas["ChartArea1"].AxisX.MajorGrid.LineWidth = 0;
    chart.ChartAreas["ChartArea1"].AxisY.MajorGrid.LineWidth = 0;
    // Add series to the chart
    chart.Series["Daily"].XValueMember = "Day";
    chart.Series["Daily"].YValueMembers = "High,Low,Open,Close";
    chart.Series["Daily"].XValueType = System.Windows.Forms.DataVisualization.Charting.ChartValueType.Date;
    chart.Series["Daily"].CustomProperties = "PriceDownColor=Red,PriceUpColor=Blue";
    //chart.Series["Daily"]["OpenCloseStyle"] = "Triangle";
    chart.Series["Daily"]["ShowOpenClose"] = "Both";
    chart.DataManipulator.IsStartFromFirst = true;
    chart.DataSource = database.Stocks;
    chart.DataBind();
}
In the Load_Click event handler, we add a candlestick series to the chart and populate it with sample data from DataGridView. Finally, we customize the appearance of the chart by setting axis labels and intervals.
VIDEO TUTORIAL
Categories
Popular Posts


Bootstrap 4 Login Page Template
Nov 11, 2024

Responsive Admin Dashboard Template
Nov 11, 2024

RuangAdmin Template
Nov 13, 2024

Gentella Admin Template
Nov 14, 2024