How to create Chart/Graph in C#
By Tan Lee Published on Mar 30, 2019 19.73K
This article explores how to use charts in a C# Windows Forms application by leveraging the System.Windows.Forms.DataVisualization.Charting namespace and connecting to a database.
How to Create Charts and Graphs in C#?
Open Visual Studio, then click New Project, then select Visual C# on the left, then Windows and then select Windows Forms Application. Name your project "ChartExample" and then click OK
First, create an Entity Framework model, and then add the Revenue table to it.
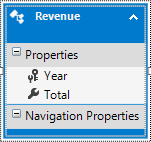
C# Graphs
Drag and drop the ChartControl to your form, then design your form as shown below.
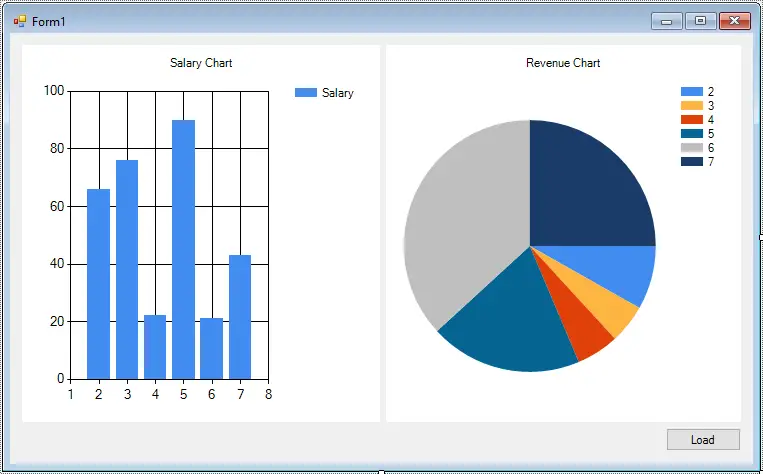
The btnLoad_Click method retrieves data from a database using Entity Framework. The data is then bound to the chart control:
// Button click event: Load data from the database
private void btnLoad_Click(object sender, EventArgs e)
{
    // Entity Framework context
    using (ChartEntities db = new ChartEntities())
    {
        // Bind data from the Revenues table, chart c# create winforms
        chartRevenue.DataSource = db.Revenues.ToList();
        chartRevenue.Series["Revenue"].XValueMember = "Year";
        chartRevenue.Series["Revenue"].XValueType = System.Windows.Forms.DataVisualization.Charting.ChartValueType.Int32;
        chartRevenue.Series["Revenue"].YValueMembers = "Total";
        chartRevenue.Series["Revenue"].YValueType = System.Windows.Forms.DataVisualization.Charting.ChartValueType.Double;
    }
}
In the Form1_Load method, static salary data is added to the chartSalary control:
// Form load event: Add static salary data
private void Form1_Load(object sender, EventArgs e)
{
    //chartSalary.Series["Salary"].Points.AddXY("Peter", 1000);
    //chartSalary.Series["Salary"].Points.AddXY("John", 5000);
    //chartSalary.Series["Salary"].Points.AddXY("Tan", 1500);
    //chartSalary.Series["Salary"].Points.AddXY("Lucy", 7000);
    chartSalary.Series["Salary"].Points.Add(1000);
    chartSalary.Series["Salary"].Points[0].Color = Color.Red;
    chartSalary.Series["Salary"].Points[0].AxisLabel = "Peter";
    chartSalary.Series["Salary"].Points[0].LegendText = "Peter";
    chartSalary.Series["Salary"].Points[0].Label = "1000";
    //Init data
    chartSalary.Series["Salary"].Points.Add(5000);
    chartSalary.Series["Salary"].Points[1].Color = Color.Green;
    chartSalary.Series["Salary"].Points[1].AxisLabel = "John";
    chartSalary.Series["Salary"].Points[1].LegendText = "John";
    chartSalary.Series["Salary"].Points[1].Label = "5000";
    //
    chartSalary.Series["Salary"].Points.Add(1500);
    chartSalary.Series["Salary"].Points[2].Color = Color.Yellow;
    chartSalary.Series["Salary"].Points[2].AxisLabel = "Tan";
    chartSalary.Series["Salary"].Points[2].LegendText = "Tan";
    chartSalary.Series["Salary"].Points[2].Label = "1500";
    //
    chartSalary.Series["Salary"].Points.Add(7000);
    chartSalary.Series["Salary"].Points[3].Color = Color.Blue;
    chartSalary.Series["Salary"].Points[3].AxisLabel = "Lucy";
    chartSalary.Series["Salary"].Points[3].LegendText = "Lucy";
    chartSalary.Series["Salary"].Points[3].Label = "7000";
}
The default chart type can be changed in the designer or programmatically:
chartSalary.Series["Salary"].ChartType = System.Windows.Forms.DataVisualization.Charting.ChartType.Bar;
This article demonstrated how to integrate chart controls into a Windows Forms application, using both database-driven and static data.
VIDEO TUTORIAL

