How to create Charts and Graphs in Crystal Report
By Tan Lee Published on Jul 16, 2024 7.54K
Creating charts and graphs in Crystal Reports within a C# Windows Forms application involves several steps.
Open your Visual Studio, then click New Project, then select Visual C# on the left, then Windows and then select Windows Forms Application. Name your project "CrystalChart" and then click OK
Create an OrderReport class to map your data as shown below.
public class OrderReport
{
    public string Year { get; set; }
    public int Number { get; set; }
}
How to insert charts and graphs into a Crystal Report
Create a Crystal Report, then open your Crystal Report file (.rpt) in Crystal Reports Designer. Design your report layout, connect it to your data source, and include the fields you want to display in the chart.
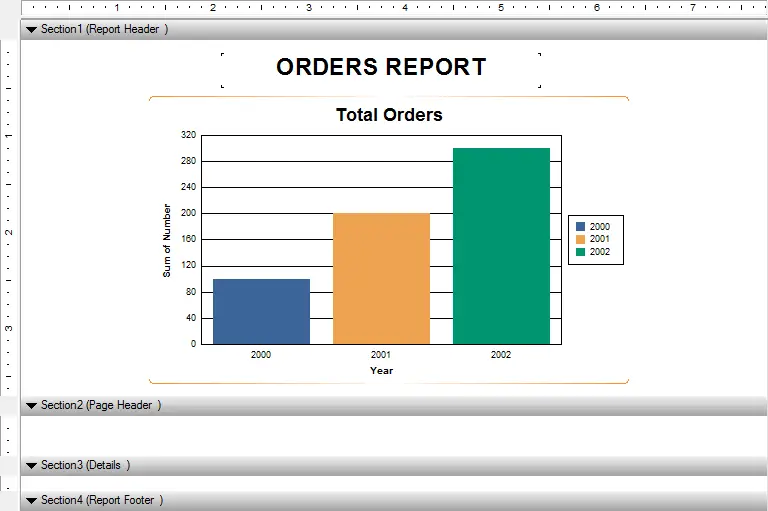
Once your report layout is ready, you can insert a chart into it. Follow these steps:
Click on the "Insert" menu, then choose "Chart" from the list of options.
Next, Drag a box onto your report layout where you want the chart to appear.
After inserting the chart, Crystal Reports will prompt you to select the chart type and data.
You can choose the type of chart you want (e.g., Bar, Line, Pie, etc.), then select the data fields from your data source that you want to use for the chart.
Once the chart is added, you can customize by double-clicking on the chart to open the Chart Expert, then you can customize various aspects of the chart, such as titles, legends, axes, data labels, etc.
After customizing the chart, you can preview your Crystal Report to see how the chart looks, then save the Crystal Report file once you are satisfied with the chart.
If you don't have Crystal Report for Visual Studio you can view How to download and install Crystal Report for Visual studio
In your C# Windows Forms Application, you need to integrate the Crystal Report file you created.
Make sure you have the Crystal Reports runtime installed on your development machine.
Create a print form with name frmPrint, then drag and drop a CrystalReportViewer control to your Windows Forms application form.
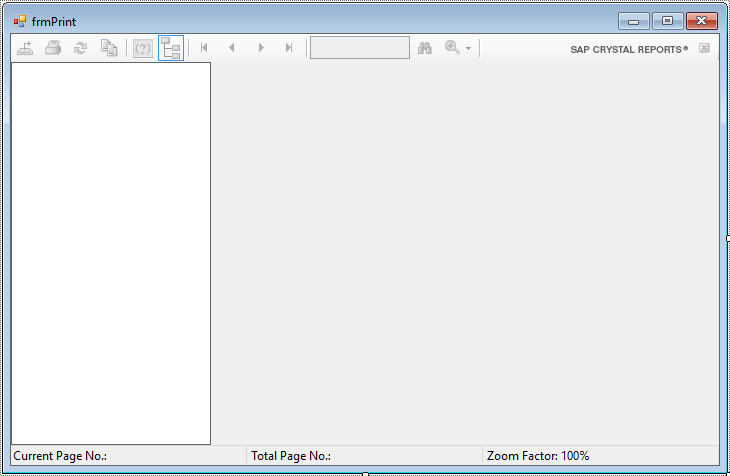
Set the ReportSource property of the CrystalReportViewer control to the path of your Crystal Report file.
Build and run your C# Windows Forms Application. The Crystal Report with the chart should be displayed in the CrystalReportViewer control.
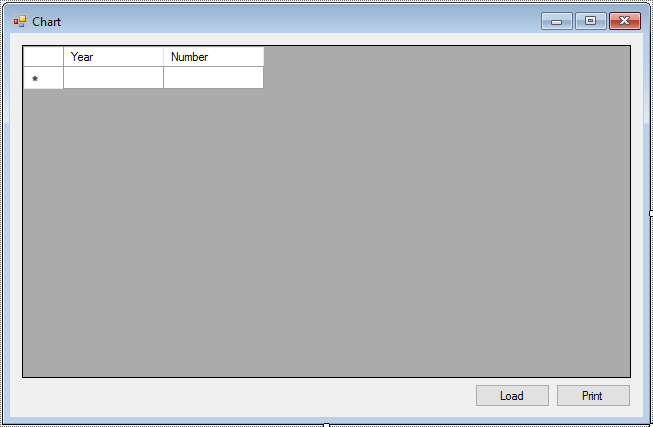
Next, Create a main form with name Form1
Add a connection string to the App.config file
<configuration>
    <startup useLegacyV2RuntimeActivationPolicy="true">
        <supportedRuntime version="v4.0" sku=".NETFramework,Version=v4.5.2" />
    </startup>
  <connectionStrings>
    <add name="cn" connectionString="Data Source=.;Initial Catalog=Northwind;User ID=sa;Password=123@qaz;" providerName="System.Data.SqlClient"/>
  </connectionStrings>
</configuration>
We will use Dapper to fetch data from sql database, so you need to right click on your project select Manage NuGet Packages -> Search dapper -> Install
We will use the Northwind database to play demo. You can view How to download and restore Northwind database to SQL Server
Here's a basic code snippet to set the ReportSource property of the CrystalReportViewer control in your C# Windows Forms Application.
Add code to handle frmPrint as shown below.
using System;
using System.Collections.Generic;
using System.ComponentModel;
using System.Data;
using System.Drawing;
using System.Linq;
using System.Text;
using System.Threading.Tasks;
using System.Windows.Forms;

namespace CrystalChart
{
    public partial class frmPrint : Form
    {
        List<OrderReport> _list;
        //Passing data to constructor
        public frmPrint(List<OrderReport> list)
        {
            InitializeComponent();
            _list = list;
        }

        // c# create chart graph in crystal report
        private void frmPrint_Load(object sender, EventArgs e)
        {
            //Set data source to report
            rptChart1.SetDataSource(_list);
            crystalReportViewer1.ReportSource = rptChart1;
        }
    }
}
Adding code to handle your Form1 as shown below.
using System;
using System.Collections.Generic;
using System.ComponentModel;
using System.Data;
using System.Drawing;
using System.Linq;
using System.Text;
using System.Threading.Tasks;
using System.Windows.Forms;
using Dapper;
using System.Configuration;
using System.Data.SqlClient;

namespace CrystalChart
{
    public partial class Form1 : Form
    {
        public Form1()
        {
            InitializeComponent();
        }

        private void btnLoad_Click(object sender, EventArgs e)
        {
            using(IDbConnection db = new SqlConnection(ConfigurationManager.ConnectionStrings["cn"].ConnectionString))
            {
                if (db.State == ConnectionState.Closed)
                    db.Open();
                string query = "select x.[Year], count(*) as Number from" +
                                 " (select OrderID, YEAR(OrderDate) as [Year] from Orders) x" +
                                 " group by x.Year" +
                                 " order by x.Year asc";
                //Execute query, then set data to data source
                List<OrderReport> list = db.Query<OrderReport>(query, commandType: CommandType.Text).ToList();
                orderReportBindingSource.DataSource = list;
            }
        }

        // c# print crystal report
        private void btnPrint_Click(object sender, EventArgs e)
        {
            //Passing data to constructor, then open print form
            using(frmPrint frm = new frmPrint(orderReportBindingSource.DataSource as List<OrderReport>))
            {
                frm.ShowDialog();
            }
        }
    }
}
VIDEO TUTORIAL
- How to Download Crystal Reports for Visual Studio 2019
- How to Download and Install Crystal Report Runtime
- How to Download Crystal Reports for Visual Studio 2022
- How to Download Crystal Reports For Visual Studio
- Crystal Reports Tutorial
- How to Create Orders or Receipts in Crystal Report
- How to Download Crystal Reports for Visual Studio 2015 & 2017
- How to Download Crystal Reports for Visual Studio 2010
Categories
Popular Posts


HTML Bootstrap 4 Login, Register & Reset Template
Nov 11, 2024

Simple Responsive Login Page
Nov 11, 2024

Login SignUp form using HTML CSS JS
Nov 11, 2024

AdminKit Bootstrap 5 HTML5 UI Kits Template
Nov 17, 2024