How to Optimize your Application using Visual Studio Profiler
By Tan Lee Published on Apr 09, 2024 3.66K
Optimizing an application using Visual Studio's Profiler involves several key steps to identify performance bottlenecks and make improvements.
Through this article, you will learn how to run code analysis in Visual Studio, as well as use the Visual Studio Profiler to optimize your programming code.
It is a dynamic program analysis tool to identify performance issues like, memory, complexity of program time, CPU usage, etc.
C# code analyzers
Creating a console application, then create a simple method as shown below.
public static void TestWriteFileToDisk(int numberOfRecord)
{
    for (int i = 1; i <= numberOfRecord; i++)
    {
        using (SqlConnection cn = new SqlConnection(ConfigurationManager.ConnectionStrings["cn"].ConnectionString))
        {
            if (cn.State == System.Data.ConnectionState.Closed)
                cn.Open();
            using (SqlCommand cmd = new SqlCommand($"select ProductName from Products where ProductID={i}", cn))
            {
                using (SqlDataReader reader = cmd.ExecuteReader())
                {
                    if (reader.Read())
                        System.IO.File.AppendAllText($"{Application.StartupPath}\\data.txt", $"{i}: {reader.GetString(0)}\n");
                }
            }
        }
    }
}
Modifyding your App.config as shown below.
<?xml version="1.0" encoding="utf-8" ?>
<configuration>
    <startup>
        <supportedRuntime version="v4.0" sku=".NETFramework,Version=v4.5.2" />
    </startup>
  <connectionStrings>
    <add name="cn" connectionString="Data Source=.;Initial Catalog=Northwind;User ID=sa;Password=123@qaz;" providerName="System.Data.SqlClient"/>
  </connectionStrings>
</configuration>
I'm using Northwind database to play demo. The TestWriteFileToDisk is a simple method allows you to get data from product table in your Northwind database, then write it to file.
We will observe the code before and after being optimized.
Modifyding your Main method as shown below.
static void Main(string[] args)
{
    // Press Ctrl+F5 (or go to Debug > Start Without Debugging) to run your app.
    TestWriteFileToDisk(77);
    Console.WriteLine("Finished !");
    Console.ReadKey();
}
How to run code analysis in Visual Studio 2017, 2019
Changing from Debug to Release mode, then select Analyze =>Performance Profiler
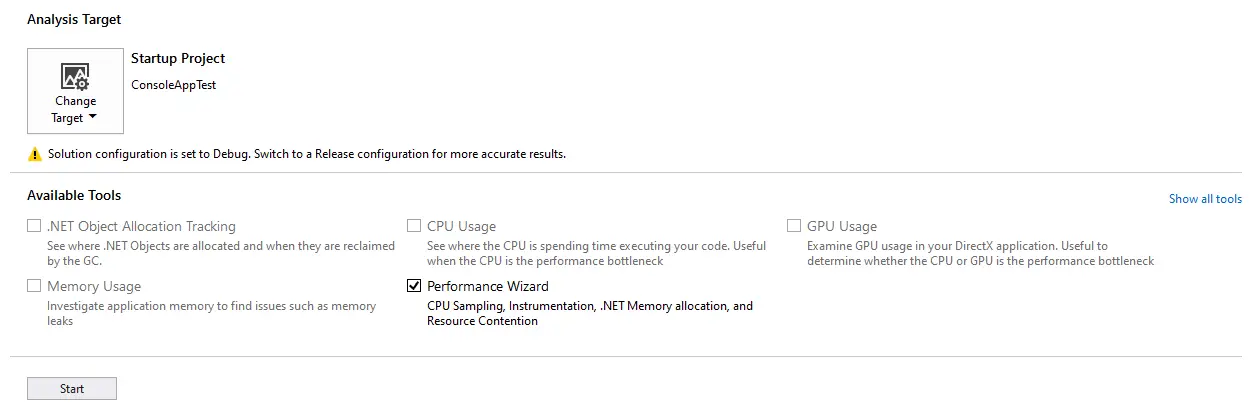
Clicking on Performance Wizard, then click the Start button.
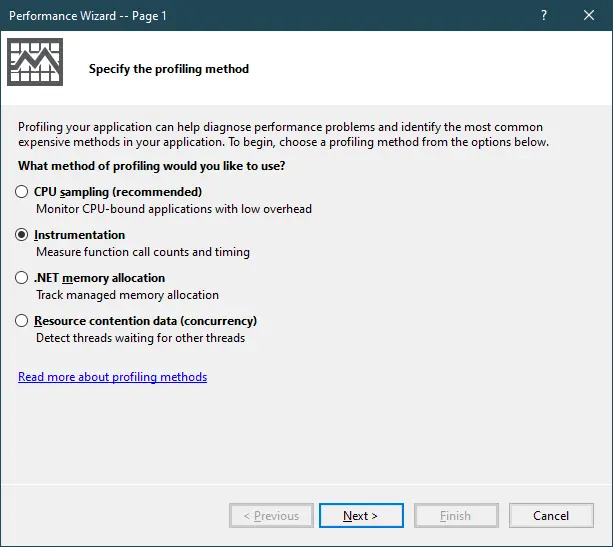
Selecting Instrumentation.
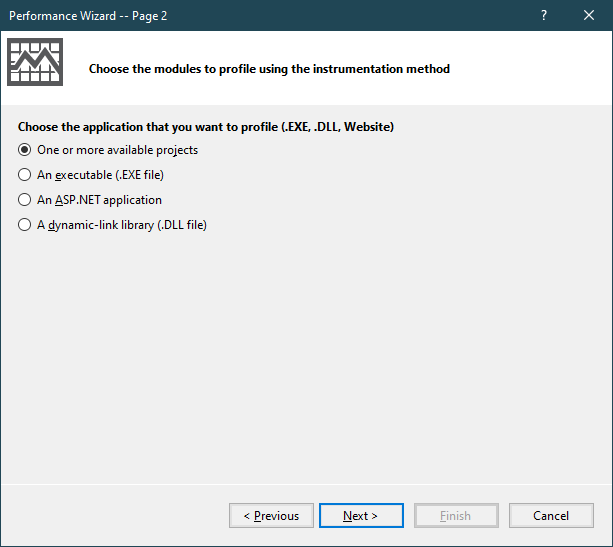
Selecting One or more available projects.
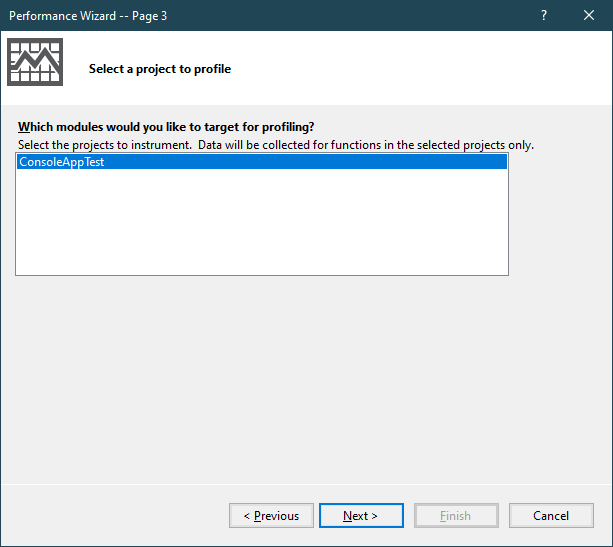
Selecting your project, then click Next button.
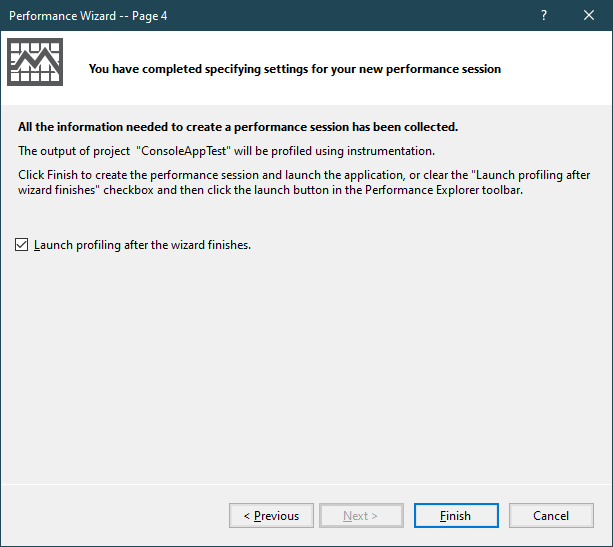
Finally, Click Finish button.
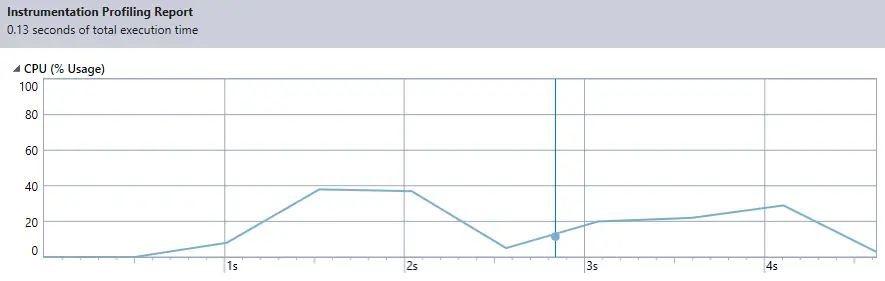
When you see the word "Finished !" in the app, you turn off the app.
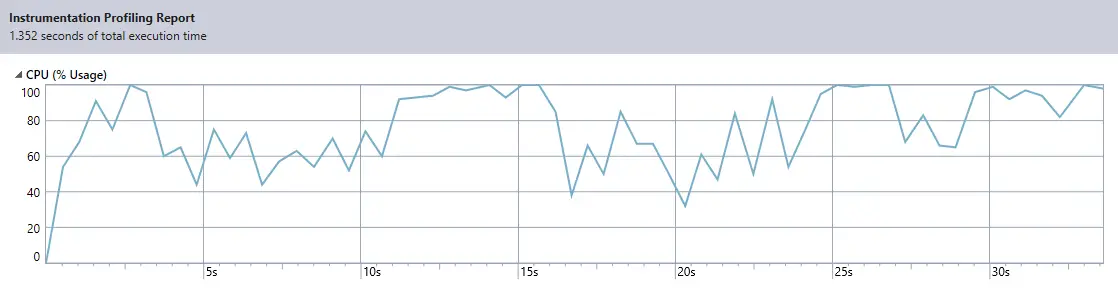
You can see the CPU usage percentage in the graph above is always high.
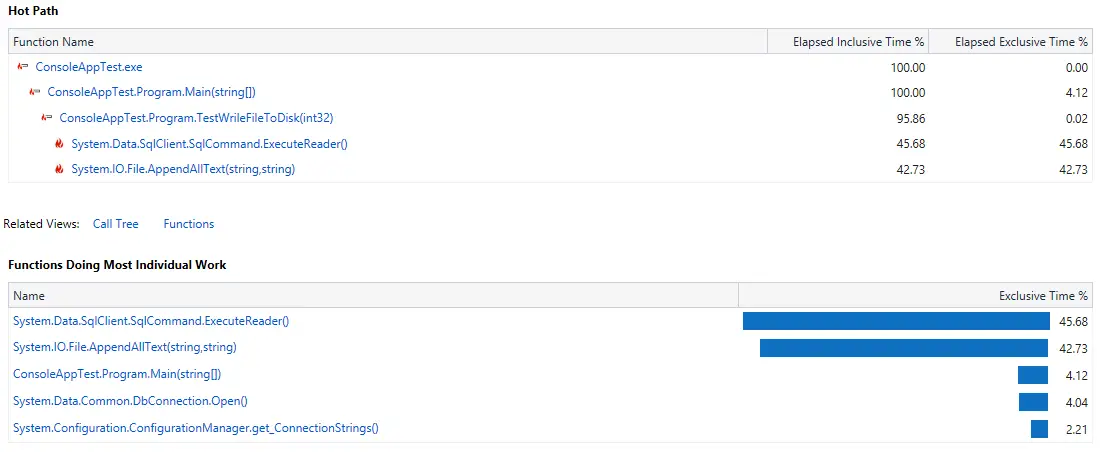
The AppendAllText method takes 42.73 percent.
Now we will optimize our code as follows.
public static void TestWriteFileToDisk(int numberOfRecord)
{
    string connectionString = ConfigurationManager.ConnectionStrings["cn"].ConnectionString;
    StringBuilder stringBuilder = new StringBuilder();
    for (int i = 1; i <= numberOfRecord; i++)
    {
        using (SqlConnection cn = new SqlConnection(connectionString))
        {
            if (cn.State == System.Data.ConnectionState.Closed)
                cn.Open();
            using (SqlCommand cmd = new SqlCommand($"select ProductName from Products where ProductID={i}", cn))
            {
                using (SqlDataReader reader = cmd.ExecuteReader())
                {
                    if (reader.Read())
                        stringBuilder.Append($"{i}: {reader.GetString(0)}\n");
                }
            }
        }
    }
    System.IO.File.AppendAllText($"{Application.StartupPath}\\data.txt", stringBuilder.ToString());
}
Moving the connection string out of the loop, using StringBuilder to concatenate text instead of writing directly to the file. Finally, We will convert the stringBuilder variable to String, then write it to file.
We will continue to reuse Visual Studio Profiler to optimize your code.
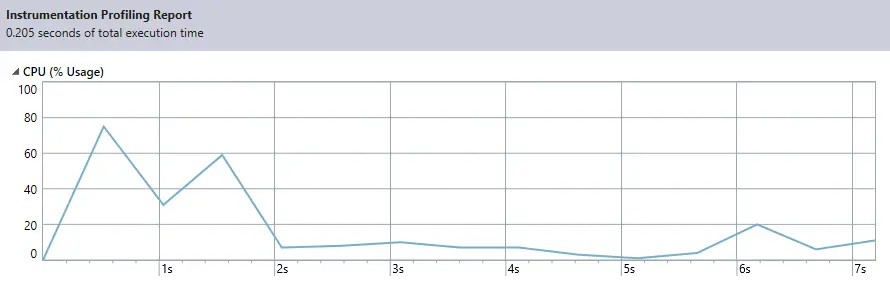
As you can see in the graph above, we have reduced the execution time from 1.352 seconds to 0.205 seconds
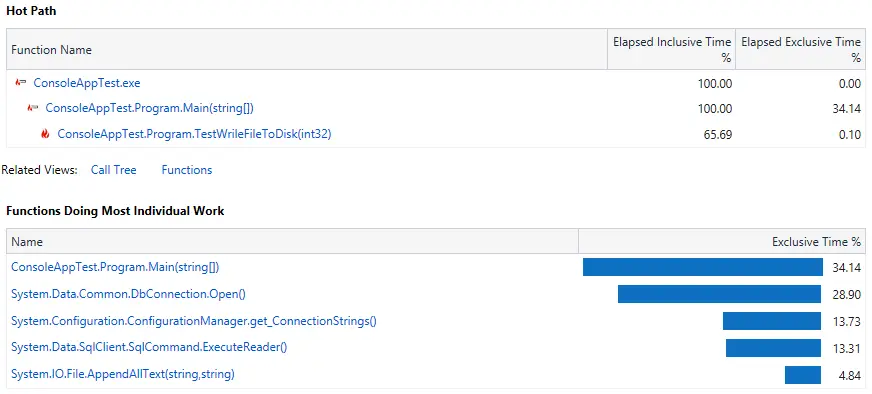
As you can see, AppendAllText method reduced to 4.84%
We will continue to re-optimize your code as follows.
public static void TestWriteFileToDisk(int numberOfRecord)
{
    string connectionString = ConfigurationManager.ConnectionStrings["cn"].ConnectionString;
    StringBuilder stringBuilder = new StringBuilder();
    for (int i = 1; i <= numberOfRecord; i++)
    {
        using (SqlConnection cn = new SqlConnection(connectionString))
        {
            if (cn.State == System.Data.ConnectionState.Closed)
                cn.Open();
            using (SqlCommand cmd = new SqlCommand($"select ProductName from Products where ProductID={i}", cn))
            {
                using (SqlDataReader reader = cmd.ExecuteReader())
                {
                    if (reader.Read())
                        stringBuilder.AppendFormat("{0}: {1}\n", i, reader.GetString(0));
                }
            }
        }
    }
    System.IO.File.AppendAllText($"{Application.StartupPath}\\data.txt", stringBuilder.ToString());
}
Using AppendFormat of StringBuilder instead of Append method.
After running your application, Visual Studio Profiler will collect data on performance metrics or memory usage.
Analyze your data to identify any areas of concern or optimization. Visual Studio provides various views and tools to help with this analysis, such as Call Tree, CPU Usage, Memory Usage, and more.
Next, Look for functions or code blocks that consume a significant amount of CPU time or memory. Once you've identified areas for optimization, make necessary changes to your code.
Focus on performance-critical sections of your code, such as loops or frequently called functions.
Consider optimizations like algorithm improvements, reducing unnecessary memory allocations, or minimizing I/O operations.
After making optimizations, re-run your application with the profiler to measure the impact of your changes.
Iterate on the optimization process, making further adjustments as needed.
Test your application thoroughly to ensure that optimizations haven't introduced regressions or new issues.
- How to Share a file between multiple projects in Visual Studio
- How to add .gitignore in Visual Studio
- How to set multiple startup projects in Visual Studio
- How to fix 'NonComVisibleBaseClass was detected'
- How to Auto Increment Version Number in Visual Studio
- How to Add a Custom Prerequisites to Visual Studio Setup Project
- The referenced component could not be found
- How to Auto increment version in Visual Studio
Categories
Popular Posts


Freedash bootstrap lite
Nov 13, 2024

Simple Responsive Login Page
Nov 11, 2024

AdminKit Bootstrap 5 HTML5 UI Kits Template
Nov 17, 2024
